San Diego County Housing Summary – December 10, 2025
|
|
Download San Diego Housing Charts – No login, no account needed.
Quick video update: Watch the December 2025 San Diego Housing Short
Call or text George at 619-846-1244
Your Home Sold Guaranteed, or I'll Buy It!*
|
| View Housing Charts What's Your Home Worth? |
I'm Looking to Drum Up Some Business by Offering Year-End & New Year's Incentives
If you're thinking about buying or selling now or early next year, I’m offering special reduced fees and commissions plus bonus marketing upgrades at no extra cost — staging support, premium photography, video, and priority off-market access.
Call or text me at 619-846-1244 for a customized proposal. I won’t be undersold.
George Lorimer
Call/Text George · 619-846-1244
|
Even Though the Holiday Market Is Less Brisk, Sales Happen Every Day…
The next 6–8 weeks offer a real opportunity for buyers and sellers. Most people pause their real estate plans during the holidays — which means those who stay active face less competition, better negotiation leverage, and a clearer path to their next move.
|
?? What’s Happening Right Now
• Inventory just plunged: active listings dropped by 408 homes (-8%) in the past couple of weeks and now stand at 4,848 homes — the biggest drop of the year and the lowest level since March.
• Still below normal: the 3-year pre-COVID average (2017–2019) was 5,905 homes, about 22% higher than today’s inventory.
• Fewer new listings overall: from January through November, 27% fewer homes came on the market versus the 2017–2019 average — 13,467 fewer new listings. However, 3,886 more sellers came on the market this year than last, and 9,838 more than in 2023.
• Demand is slipping: buyer demand (pending sales) dropped from 1,614 to 1,490, down 124 pendings (-8%), the second-largest drop this year and the lowest level since late January. That’s almost identical to last year’s 1,489 pendings.
• Market time is flat but elevated: Expected Market Time is holding at 98 days. Last year it was 83 days, and the 2017–2019 average was 80 days, both faster than today.
• Luxury is slower and uneven: luxury market time is 132 days (2–4M), 190 days (4–6M), and 351 days (6M+).
|
| ?? What's Your Home Worth? |
?? Why Buyers Should Take Action Now (Nov–Dec)
1. Less competition – Most buyers pause until January.
2. More negotiation power – Best time to secure repairs, credits, or better pricing.
3. Lower mortgage rates vs last year – Rates near 6.34% vs. 7%+ last year.
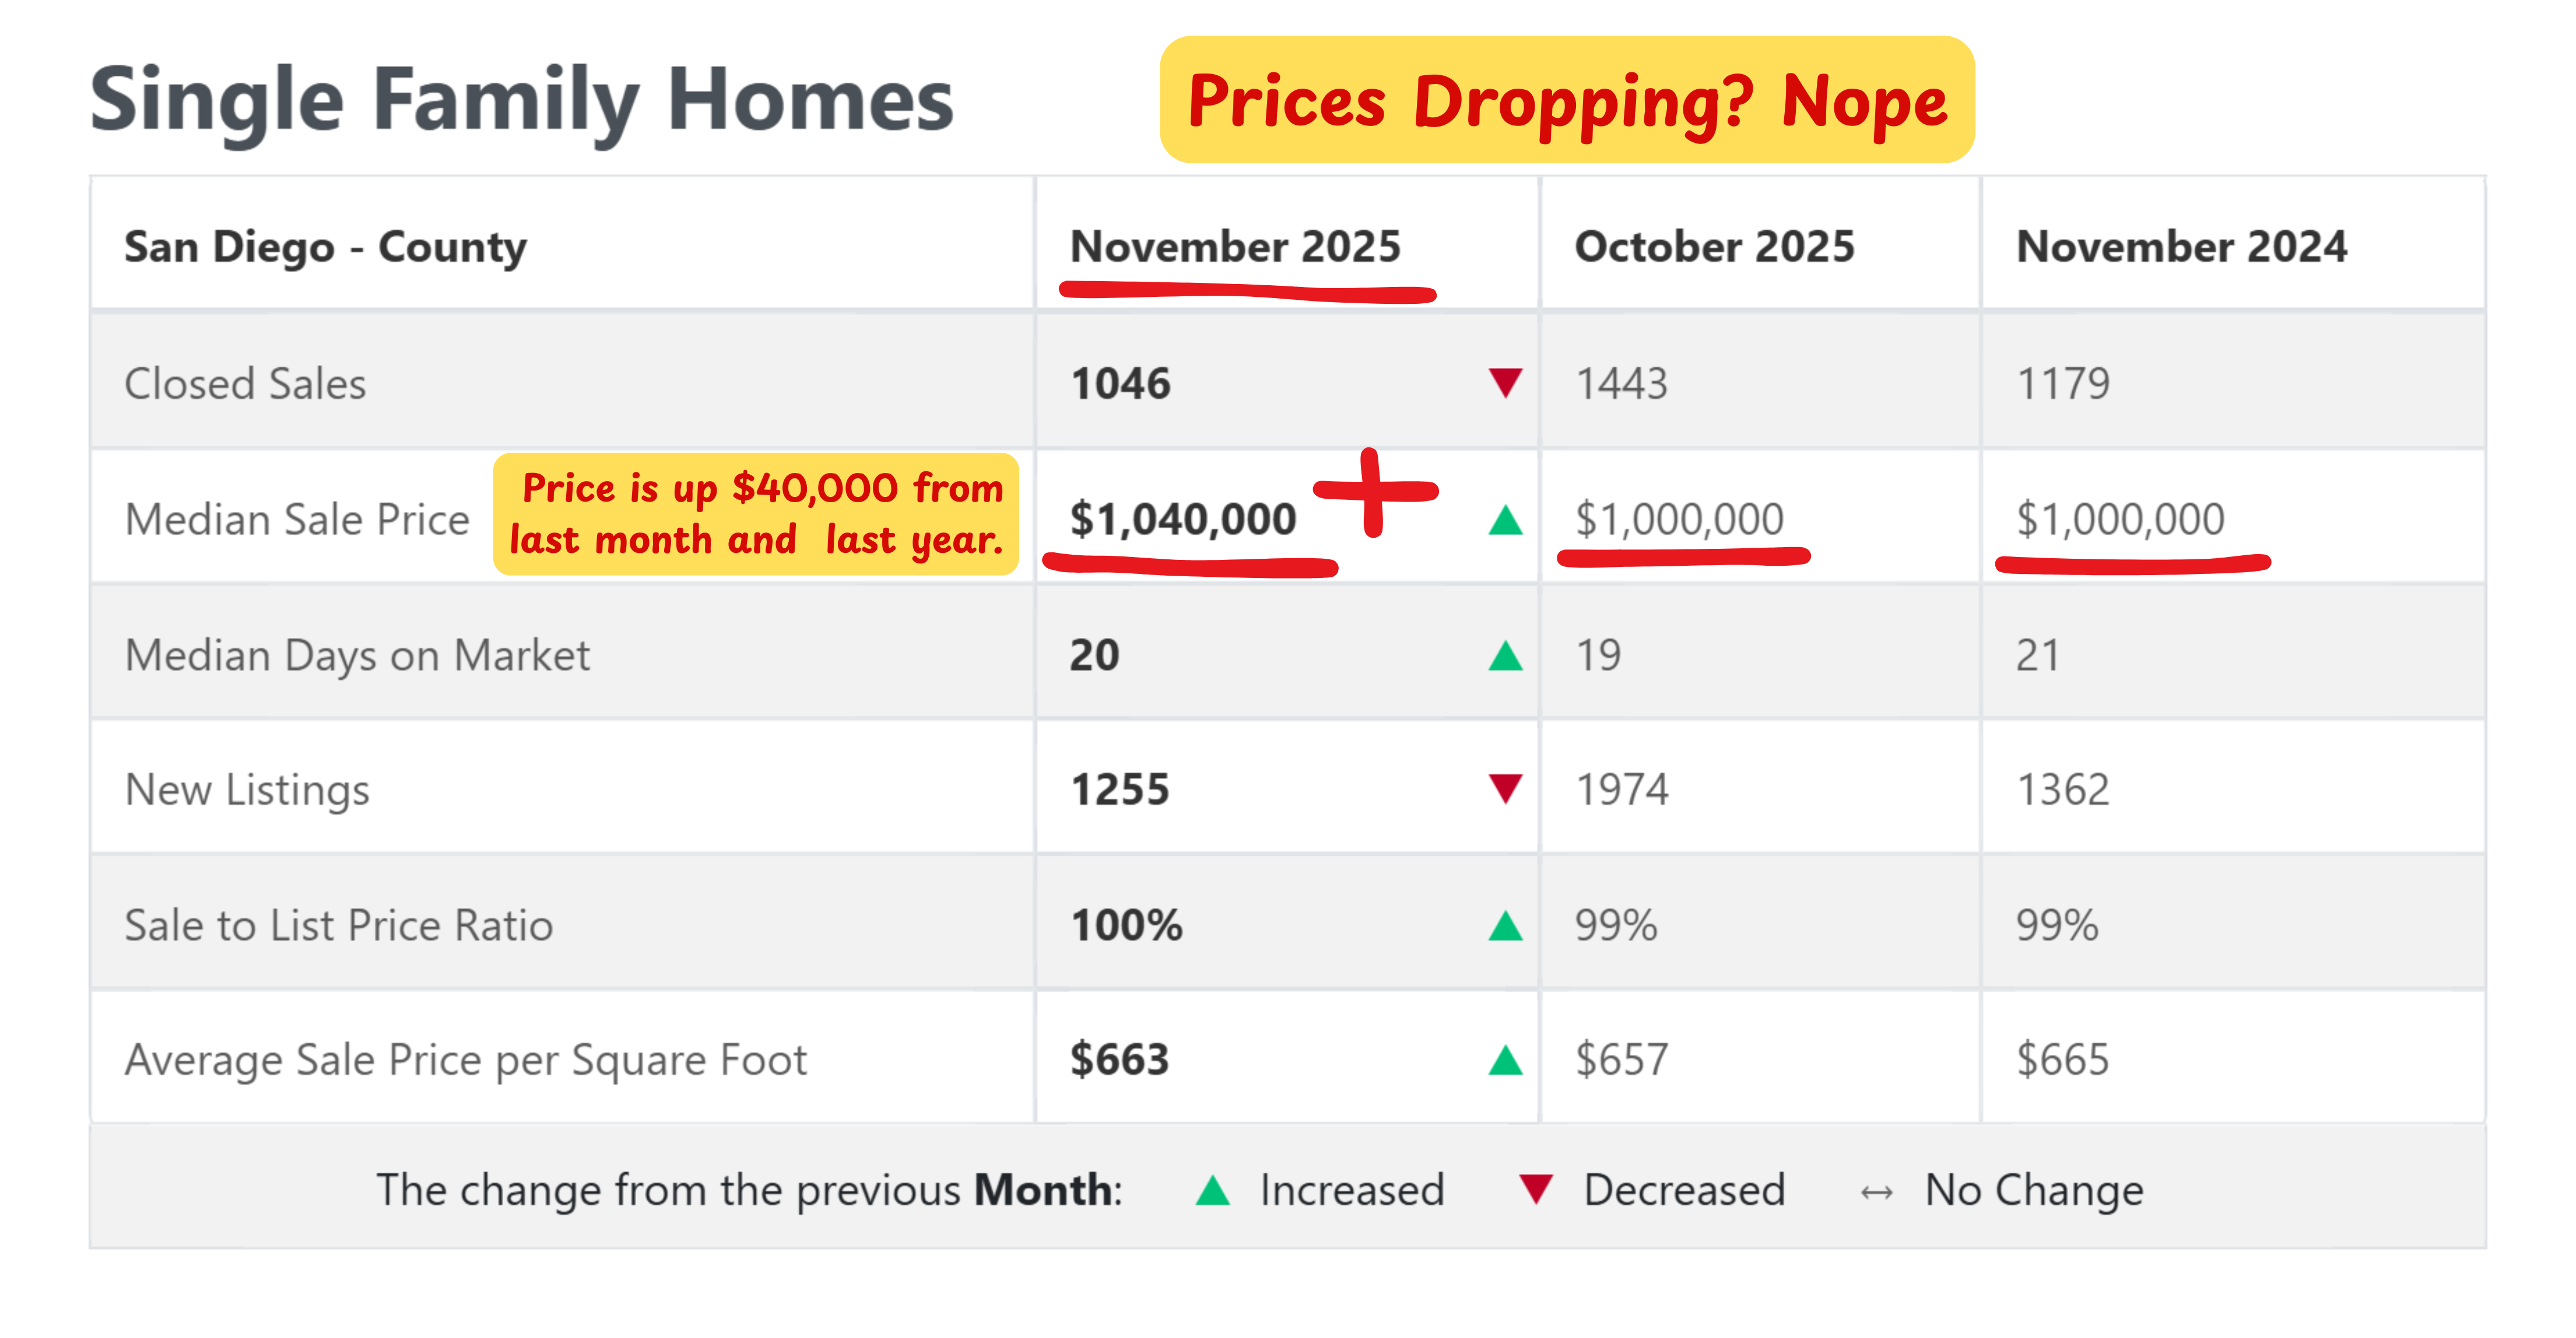
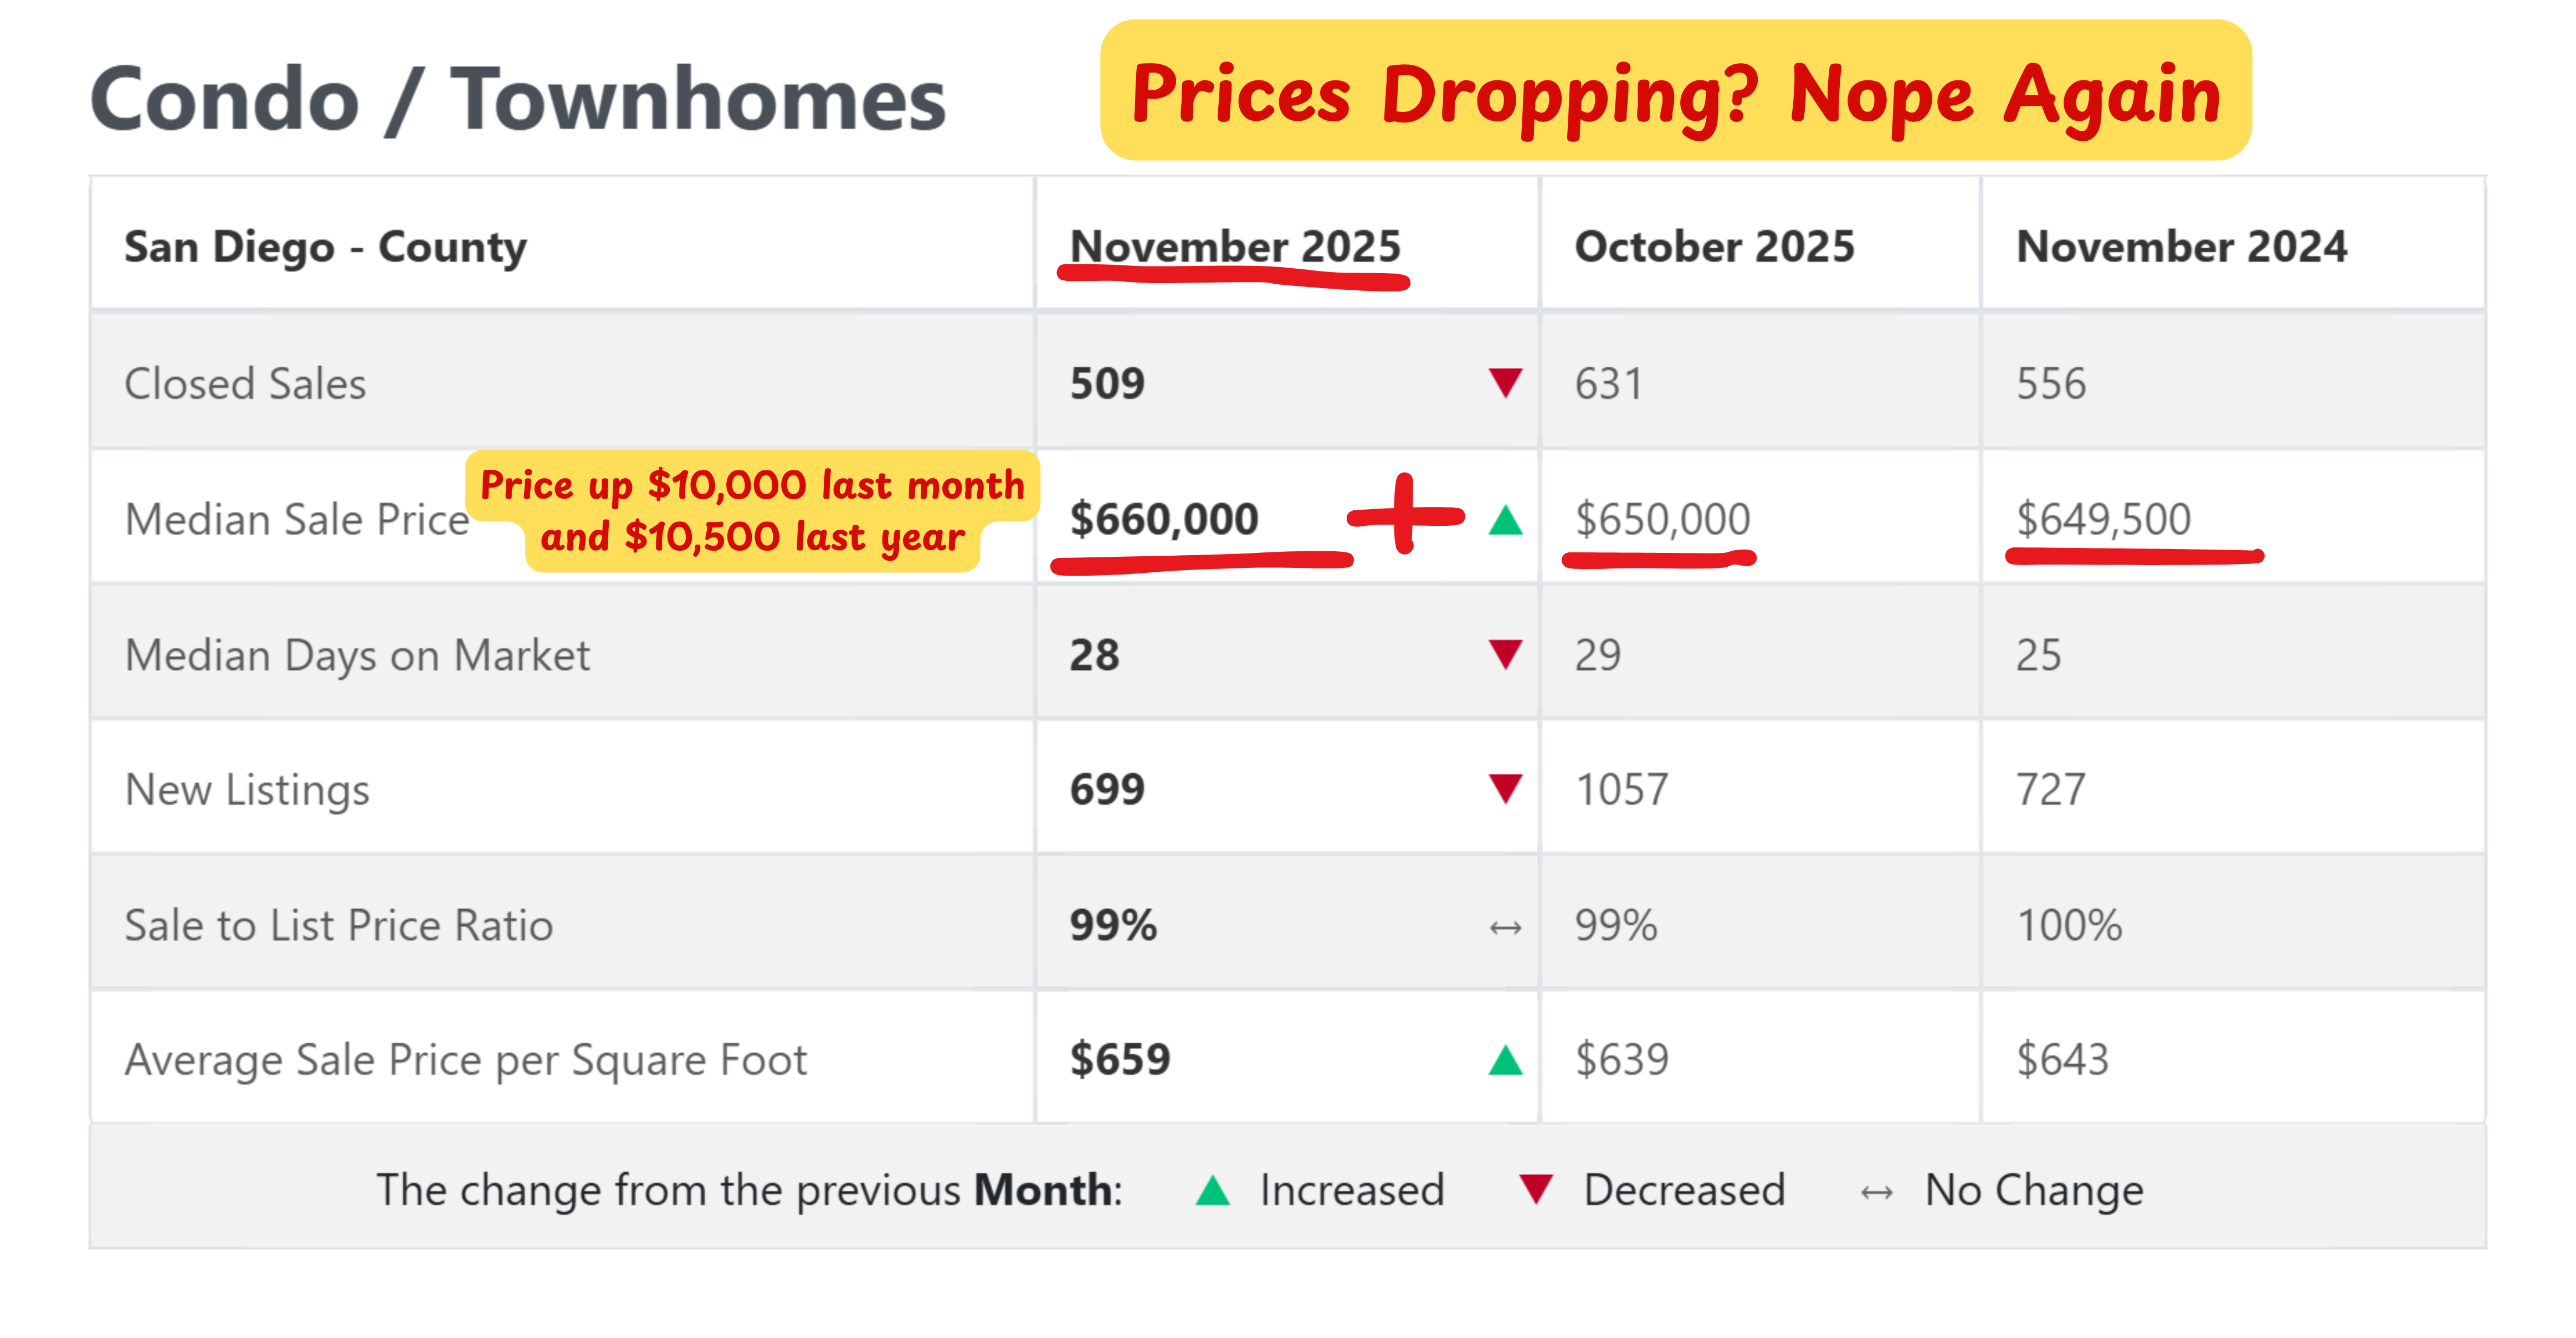
4. Prices are stable – Supply and demand are falling together, preventing major price drops.
|
| ?? Search Homes |
?? Why Sellers Can Win by Listing Before January
1. Far less competition – Inventory is dropping and fewer new listings are hitting the market.
2. Serious buyers remain active – Deadlines, relocations, and life changes don’t stop for the holidays.
3. Market time is known – With Expected Market Time around 98 days, you can realistically plan your move.
4. Get ahead of the spring surge – Feb–Apr will bring a wave of new competition.
|
?? Realistic Seller Timeframe
• Prep & Pre-Marketing: 2 weeks
• Active Market Time: ~30–45 days (faster if priced right and presented well)
• Escrow: 30–45 days
Total Timeline: ~60–90 days
List in November ? close Jan/Feb
List in December ? close Feb/March
|
?? Market Time vs. Speed of Market
Speed of Market = how fast today’s inventory will sell based on current demand.
Example: 6,000 active homes ÷ 2,000 in escrow = 3 months (˜90 days).
When planning:
14 days prep + 30 days market time + 30–45 days escrow = 74–89 days total.
Call/text George Lorimer – 619-846-1244 for your custom timing strategy.
|
| ? How Long Will It Take to Sell Your Home? |
?? Full San Diego County Housing Summary
• INVENTORY: The active listing inventory over the past couple of weeks decreased by 408 homes, or 8%, and now stands at 4,848, its most significant drop and lowest level since March. Last year, there were 4,136 homes on the market, 712 fewer homes, or 15% less. The 3-year average before COVID (2017-2019) was 5,905, which is 22% higher. From January through November, 27% fewer homes came on the market compared to the 3-year average before COVID (2017-2019), 13,467 less. Yet, 3,886 more sellers came on the market this year than last, and 9,838 more compared to 2023.
• DEMAND: Buyer demand, the number of pending sales over the prior month, fell from 1,614 to 1,490, down 124 pending sales, or 8%, its second largest drop and lowest level since late January. Last year, there were 1,489 pending sales, only one fewer pending sale. The 3-year average before COVID (2017-2019) was 2,266, which is 52% higher.
• MARKET TIME: With supply and demand falling at a similar rate, the Expected Market Time, the number of days to sell all San Diego County listings at the current buying pace, remained unchanged at 98 days in the past couple of weeks. Last year, it was 83 days, faster than today. The 3-year average before COVID (2017-2019) was 80 days, which is also quicker than today.
• LUXURY: In the past two weeks, the Expected Market Time for homes priced between $2 million and $4 million remained unchanged at 132 days. For homes priced between $4 million and $6 million, the Expected Market Time increased from 159 to 190 days. For homes priced above $6 million, the Expected Market Time decreased from 367 to 351 days.
• DISTRESSED HOMES: Short sales and foreclosures combined, comprised only 1.1% of all listings and 1.7% of demand. Only 23 foreclosures and 30 short sales are available today in San Diego County, with a total of 53 distressed homes on the active market, down two from two weeks ago. Last year, 14 distressed homes were on the market, fewer than today.
• CLOSED SALES: There were 2,083 closed residential resales in October, up 3% compared to October 2024’s 2,025, and up 4% from September 2025. The sales-to-list price ratio was 96.9% for San Diego County. Foreclosures accounted for 0.1% of all closed sales, and short sales accounted for 0.3% of all closed sales. That means that 99.6% of all sales were sellers with equity.
|
|
Copyright 2025 — Steven Thomas, Reports On Housing — All Rights Reserved.
ProWest Properties, DRE# 01146839 — *Conditions apply.
|
|
