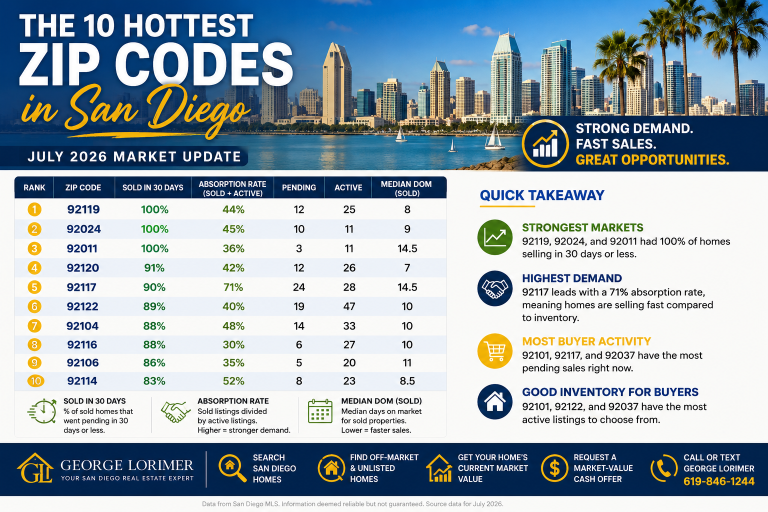
The 10 Hottest San Diego ZIP Codes
Is Your Neighborhood one of them?
The San Diego housing market is not one single market. Conditions can change dramatically from one ZIP code to the next—and even between detached homes, condos and townhomes within the same neighborhood.
I reviewed a recent group of nearly 1,800 active, pending, and sold listings to identify the ZIP codes where homes were moving the fastest. The rankings below consider the percentage of sold homes that went under contract within 30 days, median market time, pending activity, and the relationship between recent sales and available inventory. I looked at San Diego Metro and North County homes $500,000 to $2.5 million.
Start Your San Diego Home Research
The Bottom Line
The best way to understand the San Diego market is to stop looking only at countywide headlines. Your ZIP code, neighborhood, property type, price range, and condition determine the competition you actually face.
A detached home may be in a strong seller's market while condos nearby have more inventory. One neighborhood may be producing fast sales while another just a few miles away gives buyers substantially more leverage.
Whether you are considering buying, selling, or simply want to know where you stand, I will prepare a free, no-obligation report using the numbers that apply to your specific situation.
Is Your Neighborhood One of the Hottest?
Find out with a free neighborhood and property-type market report.
Call 619-846-1244 Text GeorgeThe 10 Hottest San Diego ZIP Codes
| Rank | ZIP Code | Sold in 30 Days | Median Market Time | Pending | Active | Recent Sold |
|---|---|---|---|---|---|---|
| 1 | 92119 | 100% | 8 days | 12 | 25 | 11 |
| 2 | 92024 | 100% | 9 days | 10 | 11 | 5 |
| 3 | 92011 | 100% | 14.5 days | 3 | 11 | 4 |
| 4 | 92120 | 91% | 7 days | 12 | 26 | 11 |
| 5 | 92117 | 90% | 14.5 days | 24 | 28 | 20 |
| 6 | 92122 | 89% | 10 days | 19 | 47 | 19 |
| 7 | 92104 | 88% | 10 days | 14 | 33 | 16 |
| 8 | 92116 | 88% | 10 days | 6 | 27 | 8 |
| 9 | 92106 | 86% | 11 days | 5 | 20 | 7 |
| 10 | 92114 | 83% | 8.5 days | 8 | 23 | 12 |
Ranking is based on the available MLS sample and is not a prediction of future results. ZIP codes with extremely small sales samples may produce more volatile percentages.
What Stands Out?
92119, 92024 and 92011: Every recent sold property in the sample went under contract within 30 days.
92120: The median sold property spent only seven days on the market.
92117: Strong overall activity, with 24 pending homes, 20 recent sales and a high relationship between sales and active inventory.
How Can You Tell Whether a Neighborhood Is Hot?
No single statistic tells the entire story. A useful neighborhood analysis combines several indicators and compares similar properties—not a remodeled detached home against an older condo on the other side of the ZIP code.
1. Percentage Sold Within 30 Days
This measures how many recently sold homes secured a buyer within 30 days of going on the market.
A high percentage suggests that appropriately priced homes are attracting buyers quickly. A low percentage may point to weaker demand, excessive pricing, poor property condition, or simply a market with many competing listings.
2. Median Days on Market
Median market time is the midpoint: half the sold homes moved faster, and half moved more slowly. The median is often more useful than the average because one listing that sits for 200 days can distort the average.
Lower market time usually indicates stronger demand, but it needs context. A ZIP code can have a low median market time and still contain overpriced properties that remain unsold for months.
3. Active, Pending, and Sold Listings
Active listings represent the current supply available to buyers. Pending listings show how many homes have recently attracted accepted offers. Sold listings show completed market activity.
A neighborhood with many pending homes compared with active listings is often experiencing strong current buyer demand. A neighborhood with rising active inventory but relatively few pending sales may offer buyers more negotiating leverage.
4. Absorption Rate
Absorption measures how quickly available inventory is being purchased. Real estate reports sometimes present it in different ways, so always check the formula being used.
Simple 30-day absorption percentage:
Homes sold during the period ÷ active homes available × 100
Months of inventory:
Active listings ÷ the average number of homes selling each month
For example, if a neighborhood has 25 active listings and approximately 10 homes are selling each month, it has about 2.5 months of inventory. Lower months of inventory generally favor sellers. Higher months of inventory generally give buyers more choices and bargaining power.
Absorption should be calculated by property type and price range whenever possible. The market for a $600,000 condo can be completely different from the market for a $2 million detached home in the same ZIP code.
5. List-Price-to-Sale-Price Ratio
This ratio compares a home's final sale price with its asking price.
A ratio near or above 100% can indicate strong competition, accurate pricing, or multiple offers. A lower ratio may reflect seller concessions, overpricing, deferred maintenance, or softer demand.
Important: The MLS export used for this report did not include completed sold-price figures, so a reliable list-to-sale-price ranking is not included here. I can calculate this for a specific neighborhood and property type using complete comparable-sale data.
What This Means for San Diego Sellers
Being located in a hot ZIP code does not guarantee that every home will sell quickly or receive multiple offers. Buyers still compare price, condition, location within the neighborhood, floor plan, upgrades, HOA costs and competing listings.
The homes most likely to sell quickly are typically the ones that are positioned correctly from the beginning. Overpricing can cause even a desirable property to sit while buyers choose better alternatives.
A neighborhood-specific report can show you:
- How many comparable homes are active, pending, and sold
- How quickly are similar properties going under contract
- Recent sale prices and price per square foot
- How your home compares with the current competition
- Whether selling through the MLS or considering a cash offer, may make more sense
Get the Data for Your Neighborhood and Property Type
Request a free report with current inventory, pending sales, recent sold homes, market time and an estimated value range for your property.
Text George: 619-846-1244 Get Your Home ValueWhat This Means for San Diego Buyers
Buyers should not assume every San Diego home will receive immediate multiple offers. Even within the hottest ZIP codes, opportunities may exist when a property has been on the market longer, needs updating or is priced above recent comparable sales.
Depending on the listing and the seller's situation, buyers may be able to negotiate:
- A lower purchase price
- Seller-paid closing costs
- Mortgage-rate buydown credits
- Repair or improvement credits
- A flexible closing date
The strongest opportunities are not always visible on the major real estate websites. Coming-soon, off-market and unlisted homes can provide additional choices, especially when inventory is limited in your preferred neighborhood.
George Lorimer
ProWest Properties
DRE# 01146839
Data is based on the MLS listing sample reviewed for this report. Information is believed reliable but is not guaranteed. Market conditions change, and results can differ by property type, price range, condition and location within a ZIP code. This information is not an appraisal or guarantee of value.